I have checked my mailbox and found that some of the newsletters are suitable for trading. These are:
ADVFN newsletters
GCI Financials - not too useful but at least gives some info.
Forexnews.com
GFX Group and Forex.cf
OTA newsletters
I don't really pay attention to the analyses usually. My argument is simply. The puprose of these newsletters is marketing and not my financial profit. However, these letters quite often bring my attention to facts that are interesting. Like I don't trade USD/CAD usually but one of these newsletters brought my attention to CAD. I have checked into it and it was nearly a perfect trade.
Programming Triangle Breakouts
It is about symetrical triangles:
1. Add a volatility indicator of 300 bars.
2. Add a moving avarage of 200 closes.
If 1 goes very low adn 2 goes flat. It is a triangle - most probably. Unfortunatly, it does not filter out sideway market moves... not just triangles. But it is still ok.
Using a stop. We enter the market short or long and change if it was just false breakout.
High Volume
Ed Ponssi from Online Trading Academy had the following to say:
7 a.m. GMT to 4 p.m. GMT (Greenwich Mean Time, which is the standard measurement of time in the Forex market) is an excellent time for high volume trading, because these are the hours during which traders from London and Europe are most active. Make no mistake about it, London is the world's capital of Forex trading, and is responsible for about 30% of all Forex volume. To be even more specific, the open of the U.K. session (between 3-5 GMT a.m.) and the beginning of the US session (11-13 GMT) have really high volume, as these are the most liquid times of the Forex trading day. I would give respect to breakouts that occur between 7 a.m. GMT to 4 p.m. GMT, and also (to a lesser extent) to breakouts that occur in the early part of the Asian session, around midnight GMT. On the other hand, breakouts that occur during a time of day that is notorious for low volume (late in the U.S. session or late in the Asian session, for example) can be ignored or even faded, because these breakouts tend to occur on relatively light volume.
How about Fibonacci on Forex?
Fibonacci works in Forex trading because it is a part of the Forex trading culture. [Only fib lines no other esoteric fib stuff.]
Basically, I want to use what the institutions use and see what they see, and I want to avoid analyzing anything that institutions do not use. Since institutional traders are the ones that move the market, we want to align our analysis with theirs.
For me, the bare minimum time frame for a Fibonacci retracement would be one day, but when I draw a retracement usually I am covering a period of weeks or months. Again, try to pick the one that seems most obvious...which one really sticks out? That's the one that most people will use, including the institutions and hedge funds, and therefore it is the one that is most likely to work.
NOTE: I Have the e-mail of this guy.
Products for Institution
The following are some of the products for institutions (banks, funds, money managers, portfolio managers and their traders). What is unique about these products that they are tailored for the word of currencies. While there are literally thousands of products, most - if not all - fail to address the real needs of institutions and professionals working with currencies. Examples of such failures are many:
Money management
To train the benefits (how to protect capital) and drawbacks of stops (e.g. how they reduce profit or even cause losses with working strategies) a money management education package can be used. Other subjects are: high probability trades, risk-reward ratios, etc.
Currency Trade Simulator using Fundamental Data
Learning currency trading is not possible without the use of fundamental data. Uniquely providing historical fundamental data, the currency trade simulator can "back-test" and "optimize" the trader. Testing, educating him or her on proper use of both technical and fundamental data as well as other forms of analyses correctly use.
Currency Trade Simulator is a sort of time machine. It takes the trader back in time, and he must make his or her trading decisions using technical data and fundamental data without being able to cheat (and look at the next day news or charts).
The only better way to train traders is to let them trader in the present time with real money, however, that is a bit time consuming and sometimes expensive. It is much less time consuming option to take the trader back to the past in a "time machine" and show him the news, charts and other information as it was in the past on that day.
Carry Trade Portfolio Tester
While carry trades are very popular among hedge funds and other institutions, there are practically no testing tools exist to verify currency portfolios covering also interest rate changes and their impact throughout the history of the portfolio.
The Carry Trade Portfolio Back Tester combined with Currency Trade Simulator might be the best tools for some hedge funds to invest their money to verify their trading decisions and educate their traders, portfolio managers, money managers for such a sophisticated trade set up.

- No news feed that are relevant for currency traders. E.g. economic news completely missing.
- Incomplete or missing calendar of important events.
- Even the premium-rate data feeds missing vital data and indices about future markets, or gold markets, or options, etc. and the list is very long.
- While a platform might provide 100+ technical indicators, their relevance to currencies are not considered.
- Vital forms of technical charts missing from charting software.
- No support for back testing currencies with leverage, interest rates, currency-related money management or portfolio back-testing is even completely missing.
Money management
To train the benefits (how to protect capital) and drawbacks of stops (e.g. how they reduce profit or even cause losses with working strategies) a money management education package can be used. Other subjects are: high probability trades, risk-reward ratios, etc.
Currency Trade Simulator using Fundamental Data
Learning currency trading is not possible without the use of fundamental data. Uniquely providing historical fundamental data, the currency trade simulator can "back-test" and "optimize" the trader. Testing, educating him or her on proper use of both technical and fundamental data as well as other forms of analyses correctly use.
Currency Trade Simulator is a sort of time machine. It takes the trader back in time, and he must make his or her trading decisions using technical data and fundamental data without being able to cheat (and look at the next day news or charts).
The only better way to train traders is to let them trader in the present time with real money, however, that is a bit time consuming and sometimes expensive. It is much less time consuming option to take the trader back to the past in a "time machine" and show him the news, charts and other information as it was in the past on that day.
Carry Trade Portfolio Tester
While carry trades are very popular among hedge funds and other institutions, there are practically no testing tools exist to verify currency portfolios covering also interest rate changes and their impact throughout the history of the portfolio.
The Carry Trade Portfolio Back Tester combined with Currency Trade Simulator might be the best tools for some hedge funds to invest their money to verify their trading decisions and educate their traders, portfolio managers, money managers for such a sophisticated trade set up.
Saxo FX news providers
News Providers of Saxo:
AFX Financial News
Market News International
Strategies:
UBS Fundamental Strategies
Commonwealth Bank Fx Analysis
Barclays Bank FX Analysis
Global Strategic Note
AFX Financial News
Market News International
Strategies:
UBS Fundamental Strategies
Commonwealth Bank Fx Analysis
Barclays Bank FX Analysis
Global Strategic Note
Trades

Some examples of option trades.
1. Covered call selling on Gold. Buying a put.
2. Opposite options on JPY speculating on large price change.
3. Using JPY call to cover short JPY spot position.
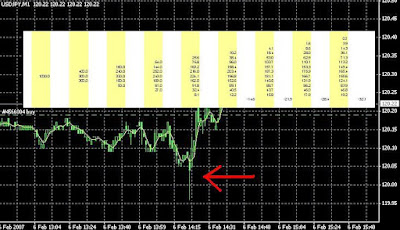
Are they against you?
 Yes, they are. That peak never happened in the currency market. Most people, including me, had a stop just under 120. That peak took those stops out on this platform.
It is a minute graph. The peak only lasted for a couple of seconds.
Nothing to do..., in this market, it is perfectly legal for the dealers to do something like this. There are only two possible recourse for such events: 1.) change dealer, 2.) play against them - using such peaks as an indication of the comming trend.
Interest Rate Trade
1 pip in EUR is 100$, 1 pip in JPY is 840$ when trading JPY. Let say the avarage true range is somewhere between 0.6 - 1.8, that is 60-180 pips. The largest change was 156 pips in the last one month period.
Interest rate in Japan 0.25% as of today. In USA, 5.25%. So if we borrow JPY for .25% and loan it 5.25%, that is 5% profit. Now counting 1:100 leverage, that is 500% profit per year. Not bad! And you can do this trade with Forex.
Unfortunatly, brokers might, and in fact do, pay interest a bit different than using the interbank rates. Naturally, they don't have own interest in mind.
So a little experiement: In 3 hours, 14 minutes, 6.2838 profit in interest was the result of my experience with 1:30 levarage. So in 1 day, let's say, it is possible to realize about 20 USD profit on 10.000 USD with 1:30.
I can set up this trade and hedge it against price fluctuations for the price of the spread. Sounds like a 0 risk trade with a 20 USD guaranted.
Unfortunatly, 1 pip is over 24 USD with 1:30 levarage. So 2 pip (the usual spread) is 48 USD. Using 1:100, 1:200 levarage would not improve the risk/reward ratio.
Unfortunatly, the cost of setting up the trade exceeds the guaranted profit.
The question remains, however, can you set up this trade so you do not need to close it overnight? If this problem can be sloved, this would be an excellent trade to set up.
The problem really is
1 day: 46.642608.
1 year: 17024,551. On 10.000 USD on 1:30 levarage.
Delta Phenomenon, Adam Theory
Adam Theory and Delta Phenomenon is a very simple tool, altough entire books written on it. You just mirror the graph on the current point (on the point, not on line) and use it as the resulting picture as a future price (graph) forcast. That is all to it - on the basic level.
Delta Society International supposed to be some secreet sociaty of 70 rich people who used this model. Anyway, as usual with many methods... there is a romantic story behind it provided and much less back-testing data provided on the workability.
Delta Society International supposed to be some secreet sociaty of 70 rich people who used this model. Anyway, as usual with many methods... there is a romantic story behind it provided and much less back-testing data provided on the workability.
Data Providers
The following are the most known data providers. (They are listed as supported by TradeStation):
Bloomberg
Reuters
Tenfore
eSignal
Bloomberg
Reuters
Tenfore
eSignal
Making money with funds
A good fund doubles its value every 5-6 years.
(A mutual fund, diversified investing into growth stocks).
(A mutual fund, diversified investing into growth stocks).
Pull-backs
About 40% of stocks will pull back at its initial investment point. Sometimes even on big volume (scary).
Is is important you have a planed stops. And you use those stops.
Again, this is a game I would play differently on Forex.
Is is important you have a planed stops. And you use those stops.
Again, this is a game I would play differently on Forex.
What to invest?
Invest into something you understand.
It is easy to get pulled into foreign stocks, foreign real-estate, close-end ufnds, low-price stocks, market hypes, penny stocks, options, futures, golds, bonds, junk bonds, tax-free securities, real estate, spread betting, neighbour's business, commodities, lottery, pilot games, etc.
The basic idea is this: there are always opportunities.
Do you really understand the area you are getting into? If the answer is no, you should not!
Value Investor
Value investor is somebody who finds a stock with good product, good fundamentals and invest into it.
Unfortunatly, he has to wait untill others also notice the company.
This is why you mix fundamentals with technicals. This is an important data to tell.
Unfortunatly, he has to wait untill others also notice the company.
This is why you mix fundamentals with technicals. This is an important data to tell.
Objective on Money
Your purpose is not to be right at all time.
But not too loose when you are wrong, and win when you are right.
This requires getting out early.
The purpose number one: protect the investment capital. Opportunities come and go. There will be always a new one.
But not too loose when you are wrong, and win when you are right.
This requires getting out early.
The purpose number one: protect the investment capital. Opportunities come and go. There will be always a new one.
Investment on O'Neil rules
O'Neil is the inventor of CANSLIM method, founder of investor.com. He mostly focuses in buy and hold strategies by buying at the right stocks at the right time and selling them on the top (with his top picking method) or replacing them with a better performing buy'n'hold stock. His ideas are based no analyzing the top performing stocks of the last 50 years both using technical and fundamental tools. William J. O'Neil: 24 Essential Lessons for Investment Success. William J. O'Neil: How to Make Money in Stocks.
The rules in short:
1. Buy stocks which earnings are growing consistently.
3 out of 4 winners had a growth rate above 30% for each of the past 3 years.
If it has no 3 years history, each of the 6 last quarters must show increase from the last years quarter of at least 50%.
2. Sales should be accelerating each quarter or at least up 25% from last year's same quarter.
3. Return on Equity (ROE) must be 20% or more.
MOst winning stocs display that character.
4. The company should have at least one new unique product considered exceptional.
5. For enter criteria use daily and weekly chart with volume. If price does not go up even against good news that has a reason. Buy on momentum and price must be up from last year.
Buy stocs that has a good base and are comming out from price consolidation (see technical analysis).
6. Buy only stocks with Relative Price Strength is at least 87%. The big winners all had that.
Relative Price index compares the price growth from the last year to the entire market segment. E.g. Nokia versus all telecommunication companies price growth.
7. If you diversify, e.g. under 10.000 max 2-3 stocks. And no more than 8 in a diversified portfolio. You can always trough out the under performing stock based on relative price index.
8. Earning and sales growth are the two most miportant fundamental data.
9. Make sure at least one other stock in the sector/group is showing good progress before buying this one. Investor's Business Daily lists about 100 different groups with their relative strength.
10. You want to be in the best subgroup in an industry. It will increase the performance at least 10-20%.
11. Investors Business Daily lists where mutual funds invested or sold. Yes, it is old data, yet it is very important data. Put your money only where the big mussles are!
Stocks never go up by accident!
12. Use technical anal for entry. Use the best possible time to enter the stock. E.g. cup and handle. However, make sure it is a properly formed cup and handle and not a failed one... e.g. a handle that is not well formed. Or a cup without a base, etc.
Also higher volumes where closes are higher is positive sign.
13. 98% of investors never buy stocks when their are on the highest point ever. Momentum traders do.
14. On break out days, valume should be at least 50% increase.
15. What is a short base: 1-4 week is short. It is risky.
16. Patterns must look good. Not too wide, or funny looking. A risk factor
17. Stocks that shoot up and no pull back -> it is a risk.
18. No increase in volume from break out from base -> leave alone.
19. If the stock is the last to break out in a group -> leave alone. It is a laggard.
20. Cup handles that are too wide, 20-30% down (too loose) or points on the bottom are comming upwards are all weak signals -> leave alone.
21. After a stock increased well, the 4th time it forms a base. It is too obvious to everyone -> it fails.
22. Don't buy low, sell high. But sell high and sell higher.
23. Buy at the handles pivot point. When it breaks above the handle's range. It is normally under the under side of the cup.
24. A normal bear market declines 20-25%. Some top stocks can decline even 75%. So good idea to get out before and not hold on.
25. When to get out? Follow the overal market/group. 3 out of 4 stocks will go after the market.
If there was 4-5 days of selling on the top. Meaning the price closed lower than the open and volume increased a bit. The stock is very likely to turn.
So 4 such sell days, over the last 2-3 weeks will likely to turn the market. Sometimes it last 6-7 weeks if market raises to new hight. But if you see four sale days... time to move on.
27. How to spot bottom?
Bear markets usualy come down 2-3 waves. Interrupted by rallies up that fizzle out in 1-3 weeks sometimes only after 6 weeks.
A 1% rise in a major index on a high volume day. Is a follow trough day. Confirms up move.
Best indexes are Dow, Nasdaq, S&P and the IBD published mutal fund index (telling what the funds are doing).
28. If the market leader is up 20-25% in only 1-2 weeks. It is a sign of strenght. So hold.
29. 40% of stocks pull back to the buying point for 1-2 days. Sometimes on big volume (scary).
30. Further sell rules:
- Earning per share is slowing down in growth for 2 quarters.
- If stocks breaks out from base, and no increase in volume -> stock demand is weak.
- If stocks breaks out from base, high volume but fails. Or even go under for several days the previous break-out point, it is a good idea to reduce number of shares.
- After several months of progress, after fourths time it breaks out from base.
- If a real market leader breaks down in the same group. Sell before other's follow.
- Gaps after an advance (from prior's day high), it is probably an exhaustion gap. However, a gap close to base is normal.
- Share closes down on the highest volume since the beginning of advance. It is a warning sign.
- Sell becase other is more profitable.
Cheap Stock
You buy what you pay for. Cheap stock is cheap for reason.
Many people hope, it doubles easier. It halves as well easier. It is playing lottery, not investment.
Many people hope, it doubles easier. It halves as well easier. It is playing lottery, not investment.
Money, emotions
Whenever your money is on the line, you will loose "cool". It is emotional.
People, hope that the price turns around instead of getting out.
People, fear that the price turns around so they get out instead of waiting their profit grows.
People are funny. Average people at least, realy funny. They hold the stocks when it is loosing value in hope it goes back, and they want to sell when it is going up in fear of loosing the profit they made.
Let's state it different: fear of making profit and hope while you are loosing?
Learn these emotions well. Fear, hope. They should not be listened to, they give wrong advice at the wrong time. It is part of human nature. When you have something like a house, you fear of loosing it. When you have nothing, you hope life turns better. Unfortunatly, it does not work in trading.
Being afraid of letting your profit grow, will limit profit. Hoping that losses go away, will stop you from action... the action of making profit instead of the loss.
The road out?
Don't trade for money - which is very emotional. But trade to trade well.
Investment Game
In investment game (not trading), put your stops at 8% of the money invested. If 8% minus, sell right away.
Common mistake: not selling but hoping.
With slippage, 8% becomes 10% already. Don't make it worse by hesitating.
In classical money management advice, you don't want to loose more than 1% of your capital in investment.
Common mistake: not selling but hoping.
With slippage, 8% becomes 10% already. Don't make it worse by hesitating.
In classical money management advice, you don't want to loose more than 1% of your capital in investment.
Don't hurry
Rule number 1: don't hurry. Most - if not every - market wizard started off as a beginner. And beginners they were for long time.
Take your time to learn the things.
And make sure you don't loose your money during this learning curve.
World is like a poker play, marketing gurus try to hassle us into giving up our hard earned dollars.
Protect your money till you learn the game.
Take your time to learn the things.
And make sure you don't loose your money during this learning curve.
World is like a poker play, marketing gurus try to hassle us into giving up our hard earned dollars.
Protect your money till you learn the game.
Information
In the good old days, we said "not enough information".
That excuse, is no longer the truth. It is a stupid excuse.
All information about companies published on the internet in governemnt webiste. All economic statistics are published. We all have access to the "trading floor" of stock exchange thanks to Internet and the latest trading softwares. We all can have access to all the news that is travelling around the world e.g. by Reuters.
Reading blogs, working with social networking websites, we can be directly exchange e-mails, chat or whatever with major leaders of companies or their friends.
Not enough information? Wow! The guy must be blind or stupid or what? The problem is what informatin to use from the sea of data?
Forex Swap
These are the swap rules of www.migfx.ch, however, the SWAP values itself are quite close to any other broker if they pay interest on both side.
For example, if you sell 1 lot eurusd and keep one night, the swap is: swap
rate (+0.4) x pip value for EURUSD (10$) x number of lots 1lot x number of days 1day=+4$,
which means you will be receiving 4$ swap. Please note on Wednesday, triple
swap applies.
This is the way, mayor, hedge funds make their money.
Currencies     Long     Short

eur/usd  -0.75  0.40
usd/yen  1.05  -1.75
gbp/usd  -0.10  0.00
usd/chf  0.75  -1.35
aud/usd  0.10  -0.30
usdcad  0.20  -0.45
nz/usd  0.25  -0.50
eur/yen  0.75  -1.40
eur/usd  -0.40  0.20
eur/chf  0.35  -0.85
eur/cad  -0.50  0.20
eur/aud  -1.55  0.85
gbp/yen  1.90  -3.15
gbp/chf  1.30  -2.40
gbp/cad  0.25  -0.60
gbp/aud  -1.10  0.45
chf/yen  0.20  -0.55
aud/cad  0.30  -0.60
aud/yen  0.95  -1.60
aud/nzd  -0.50  0.15
aud/chf  0.75  -1.35
cad/yen  0.70  -1.25
cad/chf  0.45  -0.85
nzd/chf  0.80  -1.45
nzd/yen  1.00  -1.65
xau/usd  -1.10  0.55
xag/usd  -0.30  0.10
Investment Books
The following books are recommendations of O'Neil:
O'Neil is the inventor of CANSLIM method, founder of investor.com. He mostly focuses in buy and hold strategies by buying at the right stocks at the right time and selling them on the top (with his top picking method) or replacing them with a better performing buy'n'hold stock. His ideas are based no analyzing the top performing stocks of the last 50 years both using technical and fundamental tools.
William J. O'Neil: 24 Essential Lessons for Investment Success <- Probably the gentlest introduction to do it properly.
William J. O'Neil: How to Make Money in Stocks
G.M. Loeb: The Battle for Investment Survival
H. Neil: Tape Reading and Market Tactics
J. Livermore: How to Trade in Stocks
E. Lefevre: Reminiscences of a Stock Operator
Burton Cane: The Sophisticated Investor
N. Darvas: How I made Two Million Dollars in the Stock Market
Bernard Baruch: My own Story
Peter Lnych: One up on the Wall Street
Louis Engel: How to Buy Stocks (for beginners only)
Investor's Business Daily Newsletter
Forex Addvertisments
FXDD Client
Fx-review
Moneytec
Elit Trader
Money Tec
Go Forex
Technofinaz
Signal Provider
Fx-review
Moneytec
Elit Trader
Money Tec
Go Forex
Technofinaz
Signal Provider
UK Seminars
seminars@traders-mag.com to register mine.
Here are some providers:
www.wininvesting.com
www.cmcmarkets.co.uk/seminars
www.cityindex.co.uk
www.clickevents.co.uk
www.trade2win.com
www.traersuniversity.co.uk/tmag
www.new-skills.co.uk
www.tdwaterhouse.co.uk
www.cmcmarkets.co.uk/seminars
www.tdwaterhouse.co.uk
www.learntrading.co.uk
www.clickevents.co.uk
SSF
Euroex offers now "Single Stock Future" contracts.
Sometimes spread can be better than on cash market.
Sometimes spread can be better than on cash market.
Donchian Channels
Many of the succesful automated trading systems (tracked by Futures Truth Magazine founded by John Hill) uses this indicator.
The idea is simple. It is also called "4-week rule". Whenever the price approaches a previous four-week low or high, it is likely to reverse the other direction.
The idea is simple. It is also called "4-week rule". Whenever the price approaches a previous four-week low or high, it is likely to reverse the other direction.
Pair Trading
Pair-trading is opening opposite position in different currencies that have some correlation like CHF with EUR against USD.
Exiting the trade when we get profit. Risk is limited by the fact the currences are correlated.
Exiting the trade when we get profit. Risk is limited by the fact the currences are correlated.
Profit
I try it again, to make it simple:
There are
- number of loosing trades
- number of winning trades
- avarage wins
- avarage losses.
Let's count it for one year.
These gives us in percentage of the portfolie winning.
There are also
- longest number of loosing trades in a row.
Or actually it is better to calculate as the
- maximum of (loosing trades - winning trades) in any given serious of trades.
This gives us the "risk".
There is one more thing, however:
What is the likelyhodd that the risk factor increases or decreeses? Can be counted by avarage and deviation. However, I would say that usually there is not enough data to count this.
Instead better to think it this way:
It is possible that the strategy turned bad. The market has changed. We detect it by noticing that the above maximum exceeds well our back testing. Let say by 20%.
Now, how much money are we willing to loose?
maximum sequence * 1.2 * avarage losses <>
Notes on Gap Strategies
Idea or Myth: Gap in Stock Index Futures close on the same intraday.
After comming down for several days a more than 3% gap is formed. At this point, it cannot be determined if this is an exhaustion gap (will move up) or a continuation gap (will move down). It is good idea to use entry filters like avage daily volume above 250.000 and price above 20. Stop is 20% below entry price, looking for exhaustion gaps.
For intra day gap trading: If after open tha price reaches back to its open price. Buy. Stop is placed at open price.
Hedging Against Slippage
Slippage in a falling share is big cost for the investor. However, if we know there is going to be slippage, it is possible to hedge it on a more luquid spread betting market (or CFD).
Simply, bet on the slippage while selling the share. It only works in your advantage if the price slips, in opposite moves there will be no profit.
Simply, bet on the slippage while selling the share. It only works in your advantage if the price slips, in opposite moves there will be no profit.
Fundamentals on Hungary and Europe
Hungary being my origin and EUR the currency I trade. Here are website with statistcs on these:
Eurostat for Europe: http://epp.eurostat.ec.europa.eu
Hungarian: www.ksh.hu, www.gki.hu, www.nmb.hu
Eurostat for Europe: http://epp.eurostat.ec.europa.eu
Hungarian: www.ksh.hu, www.gki.hu, www.nmb.hu
Stock Screeners
The folowing two website offers screeners for stocks (search for "Screener" or "Stockscreener")
http://finance.yahoo.com
http://moneycentral.msn.com
According to review MSN offers more.
Other screening softwares offered (not free, some has free servic but with limited functionality):
www.amex.com
www.bigcharts.marketwatch.com
www.etfzone.com
www.money.excite.com
www.hybrid.fi
www.morningstar.com
www.nasdaq.com
www.prerealtime.com - Supports currencies, commodities, futures.
www.stockcharts.com
www.zacks.com
How much can you make?
If you only make 1% in a day and you start with $1000, you would have $1.000.000.000 in less than four years.
If you trade $10.000 on Forex, you can have $100.000 in one day e.g entering and exiting USD/JPY at the very right moment.
Assuming that these targets are possible.
If you trade $10.000 on Forex, you can have $100.000 in one day e.g entering and exiting USD/JPY at the very right moment.
Assuming that these targets are possible.
Forex strategies
A couple of things to check:
1. Daily moves up and downs for highs, lows, avarage and 24-hour "open". Open time could be the first openening hour on Monday.
2. What is the probabily of price staying same level on the next day?
3. Random trades. What is the optimum stop level? Negative, positive side.
1. Daily moves up and downs for highs, lows, avarage and 24-hour "open". Open time could be the first openening hour on Monday.
2. What is the probabily of price staying same level on the next day?
3. Random trades. What is the optimum stop level? Negative, positive side.
How much to trade?
Keep trading account small enough to stay under the radar of your dealer. Dealers might push the price in one direction if that is in their benefit. If you trading account is small, it is dwarfed by other trading accounts so getting some profits here and there will stay under the radar - meaning: it is being dwarfed how much others loose while you win a little.
What is the chance of loosing?
With back-testing you can get some idea what is the probability of a winning trade versus a loosing one.
Loosing trades, especially, happening in a row eat up the money of the trader. This is why people need money management.
However, counting the probability of loosing trades is very easy. It is 50%.
Price moves up or down. 50-50% chance of loosing or winning no matter if it is short trade or a long trade.
I am not sure that even with backtesting you get a better answer than 50-50. Why? It is called backtesting drawdown. Backtested strategies tend to get weaker as time goes forward.
Spider
 Spider pattern is a powerful bearish formation. The reason for strength that this is a failed double bottom pattern.
Average lifetime
90% of daytraders give up. The avarage novice drops out in less than 6 months.
Industry avarge is 4% month if it is true.
Industry avarge is 4% month if it is true.
SuperSOES on NASDAQ
A new version of SOES (Small Order Execution System).
Orders can be directed on not directed (to a specific market maker). There are binding and non-binding orders. Binding orders forces ECNs to fill the order based on NASDAQ rules. In case of non-binding orders, market makers have 5 seconds to decide. Orders are filled in 0.8 sec. Large trading volume can slow SuperSOES.
There are 9 ECNs: INCA, MSCO, BTRD, GSCO, ARCA, MASH, ATTN, SBSH, REDI, ISLD, MLCO, LEHM. And more to come.
Archipelago is not considered ECN but an exchange itself.
Archipelago is active, Island is passive. Means archipelago arcitvily try to match the order at other firms. In case of Island, it just put in the order book which makes it faster.
Courses
The following are on one or other recommended list:
- www.pristine.com. They have a 6-month coaching program. Recommended by them and by Toni Turner
- Conernerstone Secuirities, Inc. - One of the First Companies to Specialize in Electronic Trading. Recommended by Pristine above
- Trader's Edge Net, www.daytrading.com run by Marc Freidfertig and George West. Recommended by Pristine above.
- Daily Trader, www.dailytrader.com by Toni Turner
- Daytraders On-line, www.daytraders.com by Toni Turner
- Online Trading Academy, www.Tradingacademy.com by Toni Turner
- Ttrading Markets.com, www.tradingmarkets.com by Toni Turner
Futures vs Volume
In normal stocks a high-volume breakout confirm that breakout. Trends usually occure in high-volume.
However, in future market, trends occure often in low volume and if after high-volume breakout the price reverse, that confirms the end of the trend. So volume indicator is hard to use for prediction. Indicators such as MFI (=Range/Volume) worsen trade results.
Bo Yoder claims that ATR can be used with success but does not provide statistical results.
Trading System
All of the systems on the below list perform 75-145% annually:
Open trading systems are I-Master from Keith Fitschen/Murray Rugglero (S&P, Russel 2K, Nasdaq, Mini-Value) and Balance Point from Daytrading Education (S&P).
Blackbox trading system for currencies: EuroTrader from eForex (Euro), Mesa T-Notes from John Ehlrers/Mike Barna (US Bonds), Market Rider from Parviz Harnedanian (Currencies), Dollar Trader (Currencies) from Dave Fox.
However, the current top ten performs way better: www.futurestruth.com
Forex Market
In most of my studies, I focus on Forex spot market. Especially EUR, USD and JPY.
However it has relation to:
However it has relation to:
- Bonds and their futures
- Currency futures
- Currency options (for now, I consider it seperatly from futures)
- Index and Interest futures: Euribor (On Euronext.liffe, the most liquid contract of the world), short-Sterlink, Eurodollars (On CME, the most acvitely traded contract in the world)
- S&P and Dow indeces
- DAX index
- Gold, Silver
Volume on Forex
I was worried that since I have no volume information available on Forex, I am at considerable risk following only chart signals.
However, it seems that Dr. Alexander Schwarz, one of my favorite system trader, is not using volume after all in his strategies. Simply, because he did not find the statistically relevant.
There is a light after all at the end of the tunnel.
However, it seems that Dr. Alexander Schwarz, one of my favorite system trader, is not using volume after all in his strategies. Simply, because he did not find the statistically relevant.
There is a light after all at the end of the tunnel.
Why Fundametal for Technicals?
Technical analyses is like flying an airplane with the instruments. It is very reliable.
However, it is good to know if the fundamentals are unchanged: is the airport still there?
However, it is good to know if the fundamentals are unchanged: is the airport still there?


3 close price pattern
TODO: The following is simply enough strategy to try no Forex, easty to backtest and implement.
Close of today > high of 2 days ago and close of 2 days ago > close of yesterday.
A possible rule in full: High > close & high of 2 days ago > high of yesterday & high of yesterday > low of today & low of today > close of 2 days ago & close of yesterday > low of yesterday & close of 2 days ago > close of yesterday & low of yesterday > low of 2 days ago.
And various various of this using 3 bars and different time frames and less strict or variations on these rules using different locations of 2-3-4-5 bars.
Finding New Patterns
1. Analyse the pip level history data for deviation, randomness and similar characteristics
2. Find opportunities if traded would result in > X pips win.
3. Analyse these opportunities if any pattern emerge. Backtest suspected patterns.
Contrarian Idea of Point 2
Trader's eye naturally pulled to big moves. So why not develop my system where there are no big moves and profit from small moves.
Seasons
Various seasons have different impact on prices. See various charts on www.seasonalcharts.com
Oil is cheaper in the summer. Heating prices in the winter.
Dividend payments improve mood of people.
Before holidays, people are in better mood.

Here is the Graph of IBM. So now, understand why managers are so gloomy at the moment at IBM where I worked as a consultant.
But appart from the joke. Below is the real price chart of IBM for the last 1 year. In beginning of January trading just above 96.

Bond market changes opposite to shares. As months progress forwards intrest return is nearly lineary increases. And the price swings. Well, check the website.
Obviously, Bonds are best bought in May. Since bonds are opposite of shares. Poeple invest in bonds when they don't invest in shares. End of May is bad for the share market and you can see that in the Dow Jones seasonal avarage. This is where the saying comes "Sell in May and go away".
In fact, people who follow this strategy improve their result considerably according to statistics.
Fundamental Reason
There are fundamental reason for patterns. Such as the end of year really. Starting from 12 th of Dec till 7th of Jan.
By the way, in Hungary the rally might end on mid of February on the day when the bear comes out from the cave to check if the winter has ended. I think the Hungarian market quite sensitive to bears. I wonder if this is a coincidence or people really think about this old story that every children in Hungary knows.
Now, let's see my favorite currencies.
JPY avarage from 1971-2004. EUR from 1971-2006.
WARNING: These seasonal charts must be incorrect!. Beginning of January should match up with end of December, there are way too big gaps in between. Another problem is that the website did not publish divergence data from avarage - without that information a mere avarage is quite useless as it can be just a random result nothing to do with patterns.
However, it is true that end of the year or certain quarter have impact on the companies as they must pay for the products they bought and they need to balance their books.


Let see:
So according to this EUR should raise in the end of the year. Obviously, it did not work last year, as shown on the chart's left and worked during this year as shown in the right side.

Elections Cyecles in the US
During election years the stock market is weak (shouldn't it be strong???). And it is usually the srongs during pre-election.
TODO: check this data.
Bond markets are weak before an election (so this checks out, opposite of stocs).
Do Seasonal Patterns Change?
Yes. E.g. new technologies developed in agriculture.
eSignal Experiment

Using eSignal. I have put on my screen the following JPY real-time quotes. What I wanted to see if knowing the various prices on the market, can you predict the future price move at my broker?
About the picture: the upper-left corner is two of my favorite dealers/brokers. Under those the eSignal quotes and a composite pip-level chart on the right. One positive outcome of the experiment that I fall in love with the news ticker (shown on the bottom). It is pretty cool to read about news so much before the newspapers arrive. Also I kind of hate when newspapers don't publish their sources. Here you can even see the e-mail or phone number of the article writers.
How to read the symbol: JPY is JPY/USD. @XXXX means the dealer code giving the price quite. A0 means spot market, and FX means Forex.
How to read the symbol: JPY is JPY/USD. @XXXX means the dealer code giving the price quite. A0 means spot market, and FX means Forex.
JPY@ABAA A0-FX
JPY@AD A0-FX
JPY@ALIB A0-FX
JPY@AM A0-FX
JPY@BKCH A0-FX
JPY@CC A0-FX
JPY@CCMI A0-FX
JPY@CM A0-FX
JPY@COES A0-FX
JPY@DO A0-FX
JPY@DS A0-FX
JPY@FXCM A0-FX
JPY@FXDD A0-FX
JPY@GAIN A0-FX
JPY@GFT A0-FX
JPY@HASE A0-FX
JPY@HOTS A0-FX
JPY@HSFX A0-FX
JPY@ID A0-FX
JPY@KZ A0-FX
JPY@LH A0-FX
JPY@NEDS A0-FX
JPY@NICP A0-FX
JPY@ODSE A0-FX
JPY@OH A0-FX
JPY@RF A0-FX
JPY@RTG A0-FX
JPY@SBD A0-FX
JPY@SBZA A0-FX
JPY@SEBS A0-FX
JPY@SF A0-FX
JPY@TDFX A0-FX
JPY@TL A0-FX
JPY A0-FX
One observation: COES, TDFX, AD traded on 1 pip, and ID on 2 pip. Maybe, good to remember these names. However, AD and ID were not trading at the time of the experiment. Another interesting one was OH, it was trading with around 0 pip at times.
Second observation: FXCM listed prices with 4 pip when they actually provide 3 pip service on their website. Interesting. What does this deviation mean? Are they quoting different prices to different customers? Easily possible. It is a bit troubling from a market leader in Forex.
Only 19 of the 34 listed were trading actively. So I had deleted the rest.
Unfortunately, the experiment is negative. Looking at the market is not enough help to figure out future price moves of the individual dealers.
It is possible that the composite index could be used as a kind of "poor man" volume data. It contains more information than just watching the amount of pips from my broker. In Forex, we call the number of pips during a period a volume data since there is no real volume information available for usual retail users. The composite contains the pip moves from 19 brokers giving a better Forex volume indicator.
Pip-level back testing
I want to do pip-level back testing on my strategies.
Why? Because, with a 10.000 Euro account with 1:100 leverage one pip cost me 100 USD in EUR/USD market. A move in one minute may very well be too large for my strategy to test my stops. I might want to have tighter stops. And on 1-minute data, it is not necessary possible to test.
Second reason is indicators. Let's take "Forex volume". Forex volume is counted as the amount of moves within the bar. Unless my broker has pip level historical data, I don't see how he calculates this value correctly. Maybe, he has a databas on it, or maybe, he just counts the length on the move or something else from the open, close, high, low data. I want to know that my indicators really show me what I think they show me.
Backtesting vs brokers
Forex is an OTC (Over-the-counter) market. It means: different dealers, different sell/buy prices .
Back test your strategy on the dealer you are using.
If the broker does not offer back testing or historical data, find another dealer.
In addition to back testing, monitor using a third-party system such as E-signal Forex data (50 dollar per month subscription) or some other real-time data provider weather your dealer gives you significantly different prices from the other dealers . If yes, change the dealer, he might be even cheating with the quotes you get.
Me vs Warren Buffet
The bigest names in Forex market are Warren Buffet (Berkshire-Hathaway), George Soros who made a fortune on a single trade.
And what I am most proud of that I had an opposite position with Buffet and I made profit on it - well at least on paper at that time.
The point of this article that small players play and win differently than big guys. Buffet played on the long term and I just made a quick proift (hit and run style).
Mathematics
So that I don't have to figure out the next time again when I need them.
The following must be true for profitable trades:
1 < (Avarage win * win frequency) / ( Avarage loss * loss fequency).
The above is kind of obvious.
Calculating losses in percentage:
Loss percentage all in all: 1 - ( 1 - percentag of loss per trade) ^ number of losses in a row
10 losses with 2% losses per trade result in 18.3$ loss on the account
10 losses with 3% loss per trade result in 26.3% loss on the accoutn.
Now it is possible to calculate overal account risk percentage but I hate to get that mathematical about this.
Anti-trend Trade

I have noticed in my trading that Forex is quite likely not to follow the trend channel. Probably, because people take profit early in their trades or simply Forex market just works like that.
Here is a possible way to trade this set up, long or short.
1. Wait for deviation.
2. Possible that a second trendline can be drawn. It kind of helps to find an entry point.
3. Wait for MACD trend-weaknesses. E.g. around 0.
Do the trade when 1 - 3 met. Target the old trendline.
TODO: Test the above theory
Zero-Sum Game
This is a false belief again that many markets are zero-sum games, such as Forex, Options, etc. What that statement sais is basically, what you win, somebody else looses.
I myself would have learned about the markets long-long before if I would not have known that the "zero-sum" idea is a false belief. Or at least a half-truth.
Governments print money whenever they need. Or they print 'bonds" which is practically the same as printing money. Where is Forex zero sum?
Options are created similarly. You write one, and you sell it. Both options and futures are not an empty stuff used by speculators to gain some advantage in a global poker game called "futures market" or "options market". These are very important financial tools to hedge against future risk.
When a company writes a future contract. They are hedging against potential loss. Yes, they might "loose on the trade" but actually they did not. They already know months ago their exact profit on the books, because they already had months ago this future contract. There is no loss here, it is just a "locking in of profit". A good business. And on the other side of this trade, a speculator might lost or win some money in exchange for providing the financing for this company on this contract.
Or maybe, there is no speculator on the other side of this contract, just another company wanting to fix down the price today for the future. Nobody loose in this contract. They just agreed on the price between each other and they could not care less after this deal which way the entire market moves.
On Self-study
Learning never ends.
There seem to be always more unread books no my list than read ones: http://pfornai.blogspot.com/search/label/Books
There seem to be more items to research on my TODO list than items on my entire website: http://pfornai.blogspot.com/search/label/Todo
There seem to be always more unread books no my list than read ones: http://pfornai.blogspot.com/search/label/Books
There seem to be more items to research on my TODO list than items on my entire website: http://pfornai.blogspot.com/search/label/Todo
Exchanges
Only their Forex relevance marked here.
Generally, it is believed that Forex market impacts these markets. However, it is the actual markets of real products that make the world of foreign (currency) exchange. So I do believe, it is good to know the most important markets:
Beside trade flows, another example is money flow. Ff investors get their money away from NASDAQ, NYSE (Indices of these fall) and away from US dollar, the Forex market gets impacted, dollar falls.
Another example would be a growth in gold and silver investment can signal the fall of US dollar or the currency which is used buying these. People tend to buy gold when they are afraid of value loss of the currency.
A third example would be futures and options on currencies. Companies use these financial products to hedge against currency exposure. Growth interest in such products signals uncertainity about the future of a certain currency.
AMEX, American Stock Exchange, www.amex.com
CBoT, Chicago Board of Trade, www.cbot.com, financials and indices, raw materials
CME, Chicago Mercantil Exchange, www.cme.com, contracts, options on currencies, indices.
Eurex US, Eurex US, www.eurexus.com, contrats and American government stocs
ISE, International Secuirities Exchange, www.iseoptions.com
KCBT, Kansas City Board of Trade, www.kcbt.com
NQLX, Nasdaq, www.nasdaq.com
NYBoT, New York Board of Trade, www.nybot.com, contracts, options on indices
NYSE, New York Stock Exchange, www.nyse.com
NYMEX, New York Mercantile Exchange, www.nymex.com, energy-raw materials
ME, Montreal Exchange, www.me.org, futures and options on indices and interest rates.
EUREX, European Exchange, www.eurexchange.com,
Euronext.liffe, Euronext.liffe, www.liffe.com, futures and options on raw m. and interest products, indices.
IDEM, Italian Stock Exchange, IDEM, www.borsaitalia.it
MEFF, Spanish Official Exchange for Financial Futures and Options, www.meffrv.com
SWX, Swiss Exchange, www.swx.com
LSE, London Stock Exchange, www.londonstockexchagne.com
PSE, Prague Stock Exchange, www.pse.cz
WSE, Warsaw Stock Exchagne, www.wse.com
BUX, Budapest Stock Exchange, www.bux.hu, Since, I am Hungarian, I can joke about this. I think it is a terrible choice of a name. If you pronounce the world in Hungarian, it means "you loose".
TSE, Tokyo Stock Exchange, www.tse.or.jp, Since I trade JPY good to watch the index.
OSE, Osaka Securities Exchange, futures on indices and bonds.
TIFFE, Futures Exchange, www.tiffe.or.jp, Financial futures like Euroyen
TCE, Tokyo Commodity Exchange, www.ocorn.or.jp
OSAMEX, Osaka Mercantile Exchange, www.osamex.com, futures on metal and raw material
SGX, Singapore Exchange, www.ses.com.sg, Asian indices, bonds
HKFE, Hong Kong Futrues Exchange, www.hkex.com.hk
KOFEX, Korean Futures Exchange, www.kofex.com
KSE, Korea Stock Exchange, www.kse.or.kr
BSE, Bombay Stock Exchange, www.bseindia.com
RTS, Russian Stock Exchange, www.indx.ru
SPBEX, St. Petersburg Stock Exchange, www.spbex.ru
SNFE, Sidney Futures Exchange, www.sfe.com.au
ASX, Australian Exchange, www.asx.com.au
SAFEX, Securities Exchange South Africa, www.safex.co.za
Flag Poles

Flag pole pattern shown on the picture. The distance from the base to the top
is equal to the distance of profit taking. Or at least we should have a stop there in case it moves further out.
TODO: check the relevance of this pattern of Forex.
Critic of candles

Both of these candle-stick patterns signal that the price will go up. Japanese candlestick always have these nice romantic names like "hammer" (the one on the right) and when they show them in newspaper a nice story follows about history-old use of these candlestick in Japan for trading.
On the left pattern, it is pretty obvious that the price direction changed. There is no reason to over complicate it that it is some magical pattern that works by some mysterious ways.
Also the hammer is very easy to understand. The price suddenly tested a limit and failed. Since the limit hold strong, it is likely to move the other way. It is a very fast price movement both up and down. Other way to look at it: if I am a market maker, and I know that the price is likely to go up, than I quickly push the price down (buying quickly everything) to gain a good position.
This later exactly the same activity that technicians (the market maker of a specific stop, the guy in the pit) are doing every morning when the New York Stock Market opens. They might take the price to the opposite direction at the open or for a short time period to take advantage knowing which way the price will move after that.
Eliott Waves
The Elliottician.com publishes a statistics that 65% of stocks gives bad result using Eliott wave theory.
However, Elliott waves work well with high liquidity shares where the crowed (fear and greed) reaction is also present.
Also Elliott Wave Theory (EWT) works with higher probabilty if the past lows of the share are followed by the right patter of the EWT theory.
Note: it requires considerable study time to use the program they provide, though. There are easier to use softwares also.
Markets, markets, markets
Since the avarage S&P 500 was doing very badly (minus o. People turned their attention the commodity market.
Reuters CRB Futures Price Index: 23.68%.
Energy Sector: 118.57%.
Precious Metal: 33.63%.
"Softs" (e.g include sugar): 78.01 %
In US, Commodity market is regulated by Commodity Futures Trading Commission (CFTC) since 1974.
The commodity market is well over 150 years. Actually, that is not true. Commodity market always exited and always will exits.
Hedgers (real companies with real commodities that they need to trade) and large speculators require to fill out a report to CFTC on their positions. They compromise 70-90% of the entire market each day.
Companies make future contracts to ensure their profits ni a volatile market. By making a contract for the next X months, they ensure that price level for themselves.
Strategy 1
Since you have visibility on the large traders (mostly hedgers as defined above), you can emulate what they are doing with your trades.
Strategy 2
Commodity prices tend to form clear price channels. Allowing a strategy to sell on the top and buy on the buttom. This is caused by the companies purpose to obtain on "optimal or good price" with their hedging activity. Thus price moves 80% of the time sideways. It only moves up or down when there are fundamental changes in supply or demand.
The Role os Speculators
In this process, speculators give liquidity to that market, and they provide the money for the companies for their entire activity. Basically, speculators are the ones who are financing the companies.
Unfortunatly, poor speculators are also the guys we get swallewed up easily by the giant gorrilas (the companies) when those companies make a move. Speculator can easily loose the money they provided to the giants. And the giants will not loose the money as it is only hedging for them.
Cornerstone Growth Strategy
Here is a Stock Exchange fundamental strategy with 18% gain between '51-'92 (better than 13% S&P):
- Price to sale ration > 1.5
- Earnings increased since last year.
- Select only those stocks which price increase is the largest in the last one year period. Hold those equally weighted for one year period.
S&P 500 average growth
From 1951 - 1991 the avarage S&P growth was 13% per year.
This is the benchmark. The absolute minimum to be achived by any trading.
Well, in USD at least. But let's not compare what 13% today what it would mean in Gold (this year 13% gain is about 1% loss).
From 1997 - 2007, S&P 500 growth was 7.61% on avarage. (-22.1 % in 2002 so fluctuation is very high).
Olson's Moving Avarage for Forex
Olson, one of the founders of Oanda, suggested the following :
First calculate the avarage daily move.
And the today move is weighted by how much the currency moved today. If the avarage is 100 points, and today move was 300 points, it is calculated as "3 days".
The purpose of this calculation is to "slow down time" when there are important events on the go.
First calculate the avarage daily move.
And the today move is weighted by how much the currency moved today. If the avarage is 100 points, and today move was 300 points, it is calculated as "3 days".
The purpose of this calculation is to "slow down time" when there are important events on the go.
Forex Market Makers
There are only a a dozen or so market maker in the Forex world although the number of brokers grow.
This result in high volatility (low stability) of the world of currencies.
There are only so much market makers because the large guys - with systems - crashed the small guys. Big guys can initiate positions giving major loss on small players.
This result in high volatility (low stability) of the world of currencies.
There are only so much market makers because the large guys - with systems - crashed the small guys. Big guys can initiate positions giving major loss on small players.
Stochastics/RSI used backward?
The following is from Trader's magazine. Is this useful?
Stochastic indicator shows new high (strength), however, the it is not confirmed on the index or price. Can this be used to indicate the market is declining?
Stochastic indicator shows new high (strength), however, the it is not confirmed on the index or price. Can this be used to indicate the market is declining?

RSI can be used similary.
RSI and price forms lows, higher lows, highs, higher highs, double bottom, double tops. It can have a divergence. Some of the divergencies can be ignored as not so strong, whilte others are strong indicators. SOmething to look into it.
Momentum indicator can also be combined with the aboves
Momentum indicator measures how fast the price changes in a direction.
Various Techniques
There are various money management strategies.
First. One could adjust to amount of risk taken to the likelihood of each trade. First, you only trade with small capital. And when the odds are in your favour, you commit a larger capital in proportions. I don't have a strategy that would use this sophisticated money management but in theory this might be needed.
Second. Don't count the risk on "individual trades". Instead counting the risk on a series of trades. Since he risk is counted on a serious of trades, it is possible to take larger financial risk on the series. The statistical likelihood of loosing is less. So this way, I can commit 10% of risk capital instead of 1%.
Third. Scaling in and out of risk. If I have 10.000 trading capital, and I would be willing to risk only 1% on each trade. I could only risk 100 on the trades. And this result in a very low profit ratio. Higher risk capital gives higher potential gains.
In the scaling strategy, I would risk 10% of the remaining capital in each trade. (10% is an example here.)
If I loose, I have 90% of my capital left, so again I only take 10% of the risk of this capital. And so on. This way, I can suffer a large serious of losses and still come back. In fact, even after 10 losses, I would still trade with risking 348. A considerable larger amount than risking 100 on a trade.
with higher capital in each trade, if I would only risk 1% on each trade. So I would have a potentially larger change of making profit.
Fourth. This would be a combination of the second and third strategy. If I have a strategy that has an 80% probability of winning trades (with very low deviation from the average), I can easily risk more than 10% on each trade. Mathematically, it would be possible to calculate the ideal amount but this is not a mathematical dissertation.
Win Per Pips
Assuming an USD account, the following is the profit per pip.
Let's assume we invest 10.000 USD in each trade with 1:100 leverage. Note: With 2-pip spread. Each of our trade would start with 2 pip minus, of course, but let focus now on the first pip in profit.
10.000 USD commands 10M USD with 1:100 leverage.
10M USD buys 1186,7M JPY. One pip profit is 0.1M JPY profit which is about 840 in USD.
So here is my basic 1-PIP win table:
Any currency pair where USD is the base currency will trade on 100 USD per pip.
The make the above trade, the account must minimum hold 10.000 EUR plus enough margin to cover for the minus pip moves.
Daily Moves
In the last one month period the daily moves in pip:
Automatic stops by the broker
Good idea to check what happens if zero cover remains on the account? That is 1000 traded, while the remaining cover the original was 1000 gets "eaten up by the pips against us".
Different brokers might execute this trade differently. In theory, we should have exactly 1000 EUR when the broker exited this trade. Some brokers, however, will exit the trade earlier. Some might exit it later leaving only 0 on the balance.
I think I would always use "stop-loss orders" on my trades, but it is good to check the above just in case.
Money Management
Money management is possible not by changning the levarge but by changing the bet size. That is trade only 1000 EUR at a time which is only 84$ change per pip. If I stop out on any trade that is in minus 12 pips, that is about 1000 EUR.
So on any trade, I risk 1000 EUR by trading only 1000 EUR, if my stop limit is 12 pips of entering the trade. That is 10 pips move in the wrong direction plus 2 pips initial spread.
If I have a trading capital of 100.000 EUR. For me the right way of trading is never to keep more than 2000 EUR on my trading account and only trade 1000 EUR at a time (keeping the other 1000 as cover for the minus pip moves.)
More on Money Management
Let's assume I am aiming for a large time period.
I put my stop on -50 pip but hoping for a profit, of course.
So -50 pip is the "risk" I take. Let say, my Forex trading capital is only 10.000 USD. And I don't want to risk more than 1% on any single trade. That is 100 USD risk, I am willing to take.
100 USD for the 50 pips risk. That is 2 USD per pip risk.
Unfortunatly, it also means that when I set up this trade, I can only profit 2 USD per pip on the plus side unless I am willing to take a higher risk.
From the above table: if I trade 10.000 USD, my risk per pip is 840 USD. That is 420 times higher than the risk I am willing to take.
So I must trade only 10.000/420 = 23.8 USD. Which will give me a risk of 2 USD per pip on the risk side, and a profit of 2 USD per pip on the plus side.
More on Money Management
This calculation demonstrates that with 10.000 EUR trading capital, the "1% risk" is not an easy target. Trading with 2 USD profits per pip takes quite some nerve and time to make a living on.
How can this be improved?
First, by not entering trades where the stop loss is 50 pips. Instead, always limiting the loss.
Second, a larger trading capital is needed to be both safe and profitable.
Third, it is good idea to use a statistically provable strategy or a "low risk/high probability" strategy for the trades. What does it mean?
If I could know that my strategy will never under any circumstances have a series of trades where there are more than 5 losses than wins. Example: a situation where trade results are "win, loss, loss, loss, win, loss, loss, loss, loss" can never happen as in this series there are more than 5 losses than wins.
So if we would know that this cannot happen - proven by backtesting or guaranteed buy the strategy we trade, we would only need to cover this 5 loose with our trading capital.
Can I find a trading strategy like that?
Let's assume we invest 10.000 USD in each trade with 1:100 leverage. Note: With 2-pip spread. Each of our trade would start with 2 pip minus, of course, but let focus now on the first pip in profit.
10.000 USD commands 10M USD with 1:100 leverage.
10M USD buys 1186,7M JPY. One pip profit is 0.1M JPY profit which is about 840 in USD.
So here is my basic 1-PIP win table:
JPY: $840
EUR: $100
GBP: $100
CHF: $80
Any currency pair where USD is the base currency will trade on 100 USD per pip.
The make the above trade, the account must minimum hold 10.000 EUR plus enough margin to cover for the minus pip moves.
Daily Moves
In the last one month period the daily moves in pip:
JPY: 10 - 156 pips
EUR: 11 - 178 pip
CHF: 9 - 174 pips
Automatic stops by the broker
Good idea to check what happens if zero cover remains on the account? That is 1000 traded, while the remaining cover the original was 1000 gets "eaten up by the pips against us".
Different brokers might execute this trade differently. In theory, we should have exactly 1000 EUR when the broker exited this trade. Some brokers, however, will exit the trade earlier. Some might exit it later leaving only 0 on the balance.
I think I would always use "stop-loss orders" on my trades, but it is good to check the above just in case.
Money Management
Money management is possible not by changning the levarge but by changing the bet size. That is trade only 1000 EUR at a time which is only 84$ change per pip. If I stop out on any trade that is in minus 12 pips, that is about 1000 EUR.
So on any trade, I risk 1000 EUR by trading only 1000 EUR, if my stop limit is 12 pips of entering the trade. That is 10 pips move in the wrong direction plus 2 pips initial spread.
If I have a trading capital of 100.000 EUR. For me the right way of trading is never to keep more than 2000 EUR on my trading account and only trade 1000 EUR at a time (keeping the other 1000 as cover for the minus pip moves.)
More on Money Management
Let's assume I am aiming for a large time period.
I put my stop on -50 pip but hoping for a profit, of course.
So -50 pip is the "risk" I take. Let say, my Forex trading capital is only 10.000 USD. And I don't want to risk more than 1% on any single trade. That is 100 USD risk, I am willing to take.
100 USD for the 50 pips risk. That is 2 USD per pip risk.
Unfortunatly, it also means that when I set up this trade, I can only profit 2 USD per pip on the plus side unless I am willing to take a higher risk.
From the above table: if I trade 10.000 USD, my risk per pip is 840 USD. That is 420 times higher than the risk I am willing to take.
So I must trade only 10.000/420 = 23.8 USD. Which will give me a risk of 2 USD per pip on the risk side, and a profit of 2 USD per pip on the plus side.
More on Money Management
This calculation demonstrates that with 10.000 EUR trading capital, the "1% risk" is not an easy target. Trading with 2 USD profits per pip takes quite some nerve and time to make a living on.
How can this be improved?
First, by not entering trades where the stop loss is 50 pips. Instead, always limiting the loss.
Second, a larger trading capital is needed to be both safe and profitable.
Third, it is good idea to use a statistically provable strategy or a "low risk/high probability" strategy for the trades. What does it mean?
If I could know that my strategy will never under any circumstances have a series of trades where there are more than 5 losses than wins. Example: a situation where trade results are "win, loss, loss, loss, win, loss, loss, loss, loss" can never happen as in this series there are more than 5 losses than wins.
So if we would know that this cannot happen - proven by backtesting or guaranteed buy the strategy we trade, we would only need to cover this 5 loose with our trading capital.
Can I find a trading strategy like that?
Too Much Information
It is not possible to trade without knowing enough to trade well.
However, information, reading books, articles, newspapers, newsgroups, etc. will not put money into our pocket. Only actual trading will.
According to George Andrea's research it took 1500 years to double the amount of human knowledge a few hundred years ago. Today, the available information doules with each year. (Think of Internet just as an example.)
So how can you keep up?
What moves the market?
Many people answer (indadquiatly) that if there are more buyers prices goes up, if there are more seller prices goes down.
This is not true.
For every sale, there is a buyer. For every buy, somebody is selling.
In fact, you could say that you are trading people not shares or currencies. Who is the greater fool the person who buys or the person who sells? And which one is you?
Prices moved by two factors:
This is not true.
For every sale, there is a buyer. For every buy, somebody is selling.
In fact, you could say that you are trading people not shares or currencies. Who is the greater fool the person who buys or the person who sells? And which one is you?
Prices moved by two factors:
- Supply vs demand (not buyers vs sellers)
- Manipulation by market makers (by people with a large pocket)
By the way, this is the reason why people monitor volume of trades not just the price. Volume will tell if the price was moved by real big demand or by just a temporay weak supply or demand. The volume tells this story.
The Learning Curve
How much is my starting capital? If I have 100.000 Euros, and I only make 20% per year. That is only 20.000 Euros income to live on.
How long will it take to learn to trade even as well as 20% per year?
When will I be able to make more money with investment and trading?
If you go to play chess with a chess grandmaster, you know you are up against a heavy player and it will take years to be on a level to win games reliable on competitions. The same is going in my profession, it took long time for me to become so good at it to earn competitive salaries. Do I think that learning to trade - against all the amateur and professional people on the market - is hard?
Am I ready to quit my job and become a full time trader?
Minimize loss, Maximize win?
If I loose 10 time 1 Euro. And win 1 time 10 Eur. I am still loosing even though I have minized the losses. Even if there is no commision on Forex, I am still loosing time and my interest to trade.
Many books suggests that you only enter a trade where you win more than your risk. That is not a flawed rule as it is incomplete. It is also necessary to calculate the probability:
How many times do you win and how much? How many times do you loose and how much?
If I win 10 times 2 Euros. And loose 6 times 3 Eurs than I am in profit of 2 Euros on every 16 trades even tough my losses were greater than my wins.
Triangles

Triangles, help us predict price direction. The triangles on the left are easy to understand: somebody does not let the price go over the limit.
The triangles on the right are undecided, although, they tend to break out in the direction of the previous trend.
What if the support/resistence above under the triangle breaks? New channel might form parralel to the leg of the triangle line:

Social Groups
Trading is a lonely profession. Here are some excellent social groups that you can join to chat and find other traders.
www.trade2win.com: It gives possibilty to seek out other traders in your area.
www.advfn.com: Offers some services to traders. Includes GTIS quotes.
www.moneyam.com:
www.forexfactory.com
Any social group platform is also a good source to find traders:
Yahoo groups.
Google groups.
Note: there are open groups and there are limited ones. The ones that are open are often full of junk and no specific strategies are discussed there.
TODO: Add all the social groups I use in the future.
www.csta.org - Canadian Society of Technica Analysts.
www.stockcentral.com
Amibroker's user group: http://finance.groups.yahoo.com/group/amibroker/messages/
http://www.moneytec.com/forums/
TradeStation user group
Meta... user group (MIG)?
TODO: Eveluate news
Economy
If US economy gets weaker against Japan, the JPY should strengthen.
Inerest rates:
Higher the interest, the stronger the currency.
On the other hand, high interes-rate -> investors withdraw money from stock market -> negative effect on currency.
Balance of Trade
If a country imports more than it exports, it means currency is going out, which should weaken the currency.
GDP
The benchmark of economy. GDP on the increase, ecnomy on the increase, strong the currency.
PMI
Production Manager Index indicator of industry. Above 50 is expension, below 50 is contraction.
Industrial Production
Factory prodcution level, taking also inventory into consideration.
Central Banks
They can alert, support or devalue of their currency. Central banks intentions must not be ignored.
Politics
In turmoil, capital goes out of the country, currency goes down. Especially important if trading currencies like HUF (being non-major currency).
Is Your Broker Regulated?
Do not use unregulated brokers. Here is how to find out if your broker is under the control of a regulatory body:
- Great Britain: Financial Services Authority (FSA), www.gsa.gov.uk
- US: Commodity Futures Trading Commission (CFTC), www.cftc.gov, National Futurs Assocation (NFA), www.nfa.futures.org
- Switzerland: Eidgenössiches Finanydepartment (EDF), www.edf.admin.ch
- Germany: Bundesanstalt für Finyndienstleistungsaufsicht, www.bafin.d
- Australia:
Diversify. Even regulatory bodies will not protect against the broker going bankrupt. So it is recommended that we do not commit all of our trading capital to a single broker.
Mini vs Standard Account
Mini accounts usually come with higher leverage. I like to trade with high leverage so I use mini accounts.
The drawback of using a mini account is that you trade with lower capital, however, twice as much leverage requires half of the trading capital.
The drawback of using a mini account is that you trade with lower capital, however, twice as much leverage requires half of the trading capital.
Pivot Point
Pivot trading is useful for trading days when there are no important market news released.
If you look at price data, it has:
If you look at price data, it has:
yesterday high
yesterday close
yesterday low
Pivot theory beleives that the price will only move as much today as it moved yesterday. Opening price is disregarded (in trading shares opening prices can falsly gap due to the market maker decision).
So the price today start at yesterday close. And it can move as much as much down as yesterday it moved from the high to the close (support 1 or S1) or it can even move as much as the distance between yesterdays high and low (support 2 or S2). The same is true if the price move upward.
Pivot Support and resistance prices:
Actually drawing it would be much easier than understanding counting...
PP = (high + low + close)/3
S1 = 2PP - high.
S2 = PP - high + lowR1 = 2PP - low
R2 = PP + high - low
Usualy price moves between S1 and R1. If even the second support is broken, we can assume that the price is going to trend further.
Variations on Pivot
I would also use the intraday moving avarage instead of the close price. In a 24-hour market, deciding in an arbitrary close value is not so reliable. Which hour do you choose as your closing hour?
Another strategy that I would try is to use is the current price:
- 24-hour previous high
- current price
- 24-hour previous low
However, no need to become too mathematical about this as you can see with the bare-eye which direction the price is likely to move and how much on the graph.
Practical Application
The pivot point and the other lines can be used to calculate the probabilty of price moving between the limits. It is a strategy that can easily and perfectly backtested!
Really? Longer Than 10-year Trends?
Market Analyses
I have never seen in professional literature the following data but it must be noted.
The world of currencies undergo a considerable change in about ever 10 year.
Monetary systems of the world collapsed quite many times in the last hundred years. This required setting up new monetary systems.
Also originally certain currencies like USD was tied to Gold. This is not the case, anymore.
Let's take this as an example.
A USA dollar required a Gold reserve. Is not the same as a USA dollar that can be freely printed. I would go as far as saying, "it is a different currency". It is still cold USA dollar but it is a new currency.
Similar can be said about other currencies like CHF, HUF, EUR, etc.
Forex traders tend to use fundamental analyses on long-term investments. And yes, it is true that technical analyses results "seem to be checking out correctly" but still I would not try to relay on it.
EUR is only 5-year-old
So what? I understand that some traders try to get long-term historical EUR data buy comparing it to ECU or before that to Deutche mark. It is like comparing oranges to apples. EUR has a very far-fetched resemblance to the old Deutche mark: different world structure, different countries, different money system, different trades between countries.
Forex Fundamental vs Technical
According to statistics, brokers generaly like technical analyses on the short run (like 1 week period).
Fundamental analyes clearly dominates on long-term investments (undertsandably).
On very short term (intraday trades). Professionals would use trade flows (not available for private investors) and news releases.
It the word of Forex, there are no clear techinicians and fundamnetal analysts. Generally, all available methods are used.
OTC Market
Forex is over-the-counter market. Meaning brokers quotes can different from each other significantly enough (especially during fast market moves) to make short term technical analyses unreliable.
Possible solution is to watch several data feeds.
Using Technical Analyses on Futures
The problem with this is interest rates that is reflected on the price. Usually, technical analyses is applied to spot prices because of this.
Are you a Speculator?
In the world of Forex. Any individual who is exchanges currencies not because of an underlying product but for any other reason is considered a speculator.
Actually, this definition also applies to any other market, although, the legal (official) definition is quite a bit longer in the legal books.
E.g. a company importing jewelry from China is not a speculator as it needs currency exchange to execute the trade or to hedge against some risk. In short they buy currencies for use.
However, banks, individuals, professional investors are all can be considered as speculators. They buy, sell or hold currencies for profit which is the exact definition of a speculator.
Why is speculator a bad word?
I don't know.
There is no such thing as speculators vs investors based on the definition of the world. The opposite of the speculator is the "looser". Speculator trades for profit, losers on the other hand loose.
Speculators are Important
Speculators give value to the market and no free market can exist without them:
- They provide liquidity to the market. Without them who would buy or sell you on certain days?
- They lessen the price swings (volatility) by their own activity to profit which is beneficial for the industry.
- Speculators (be big or small) who finance the activity of companies who are hedging their trading on the commodity futures market. So real companies with real products need the financing that speculators provide for their activities.
Speculators, actually, can be considered as the innocent guys who might loose their money just because they helped these companies by giving them their money on the future contracts if the large players (the actually companies) move the other directions - if the supply and demand changes.
Why Forex?
- Tax free income. All you do is you change your currency from one to the other so why would a government want to collect a tax on money?
- Can be done in 24 hours a day. Anytime during the day
- Any place on the world.
- It is possible to paper trade Not like in the stock market, the paper trade results are practically identical to real trades.
- You can only loose the amount of money that is on your account - if you do something really stupid. No further risk but unlimited potential.
- No office required, no special dressing code.
- Very high leverages, even up to 1:400.
- Immediate fills.
- No broker commissions.
- Very tight difference between buy and sell price.
- It is the largest market of the world exceeding 3 trillion per day!
- The most liquid market of the world. It is cash after all that you trade, isn't it?
- For a technical analyst it is an ideal market. For fundamental analyst it is also a perfect arena to try their strategiest.
- Low investment. Low starting capital. And very-well manageable risk.
- Unlike in stocks you only have to choose from a limited number of currencies. So no time wasted in "stock selection".
- There are no margin calls from your broker asking to pay more money because your broker can automatically close out your loosing trades within a blink of an eye. You can also use practically guaranteed stops to get out of losing positions.
Hedging Against Currencies
The following is a gently introduction to the world of hedging.
Let suppose I loan 5000 Euros to my younger brother in Hungary in August, 2005. Since he leaves in Hungary, he would like to receive this money in Hungarian Forint. He pays me back this loan exactly one year later in Hungarian Forint.
In August, 2005, 5000 Euros are exchange to 1.225.000 HUF. Because the exchange rate was 1 EUR = 245 EUR at that time.
One year later, he pays me back the 1.225.000 HUF. In August, 2006, 1 EUR = 279 HUF. So I get 4390.7 EUR.
That is a loss of 609.3 EUR! And I cannot even back out of the loan as he is a family. So what can I do?
Large companies can ask the banks "Hedging Consultant" to help to solve the situation. In fact, it is very surprising to me that many large companies do not know that such services are available for them. But what can you do if you are not a large customer of a bank? Can you protect your money against such currency changes?
The poor-man way of hedging
I choose one of Forex broker websites. I open an account with 200 Euros on it. The leverage they provide is 1:100. I need to choose a broker that supports Hungarian Forint - one of the banks, let say.
In this example, I choose a Forex broker that does not pays or deducts interest rates from the trades as that would complicate a bit this example.
At the same time when I give the loan of 5000 to my younger brother, I also open a trade with this Forex broker.
And I "go short" on Hungarian Forint. That is: I sell Hungarian Forint, and buy EUR at the same time. It takes 50 EURs (1:100 leverage) to make this trade.
What I did? I simply entered into an opposite trade with my loan. In the loan, I was buying Hungarian Forint on my Euro. In the trade at the Forex dealer, I do the opposite, I sell Hungarian Forint, and buy Euro. Luckily, thanks to the 1:100 leverage, I only need 50 EUR for the trade.
In August, 2006 when my younger brother pays me back the loan and I get 4390.7 EUR from him. I also close this trade with the Forex broker. The Forex trade will be in a profit of exactly 609.3 EUR! Just the money I needed to get out of this.
Why is this?
So at the start, I was selling HUF and buying EUR at the Forex broker. I was selling 1.250.000 HUF for 5000 EUR.
To close this trade, I need to buy back this Hungarian Forint on the current price. In August, 2006, the price for 1.250.000 HUF is only 4390.7 EUR.
So in practice, I have bought for 4390.7 EUR Hungarian Fortint and I have sold it for 5000 EUR. So I made a profit of 609.4 EUR on this trade.
What would have happened if HUF gets stronger during this one year?
In that case, I make exactly as much loss no the Forex trade as my younger brother pays me more money.
By the way, this is why I would open the account with 200 Euros because the Forex broker automatically closes my trade if I don't have enough money on the account to cover my losses. I was thinking that 200 Euros is large enough to cover the one year.
Understanding Hedging
Understanding the above calculation is not easy. But it is the basics of hedging against currency exposures.
In a professional hedging word, I could have used some other more sophisticated currency tools instead that are more suitable for this purpose but understanding these are well beyond this article.
Hedging International Loans
Many people in Hungary get loans from Swiss banks because its much more beneficial interest rates. Swiss banks interest rates are considerable lower than those of a Hungarian bank.
Unfortunately, this exposes people to a considerable currency exchange risk for a long term.
What if the Hungarian Forint falls against the Swiss Frank? It means people will need to pay much larger monthly installments. Maybe, they are not even possible to pay it.
So in a 30-year loan, understanding hedging can be quite beneficial for everyone.
Many people do not even think, it is possible to protect against such events. As the above article demonstrates, it is possible even if it might take a head-ache to follow the calculations. Note: many Forex brokerage firms offer hedging service for private customers.
Subscribe to:
Posts (Atom)